Rilasciata in produzione applicazione Wasteful basata su Flutter
11 Marzo 2022
Il [Kubernetes] (o k8s) è una piattaforma self-healing e opensource per l’automazione dei deploy, l’orchestrazione dinamica e la gestione delle applicazioni nei container.
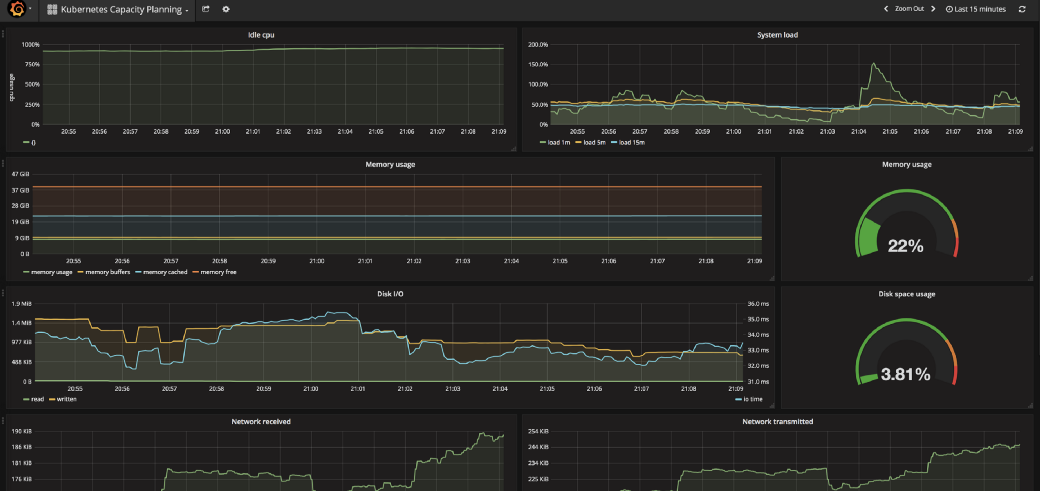
Tutto il progetto Kubernetes ha abbracciato la tecnologia Prometheus e quindi offre supporto al relativo protocollo per il monitoraggio sui servizi presenti nella suite k8s con tanto di alert e generazione automatica di pannelli con grafici (CPU, Rete,…) che diventano fondamentali per evitare interruzioni e analizzare disservizi in genere.
Il montoraggio del cluster può essere effettuato tramite tipologie diverse di architetture:
tramite il [Prometheus Operator] (progetto Opensource della CoreOs) interno al k8s
tramite un Prometheus esterno al cluster k8s che si integra con il Service Discovery del k8s
In questo articolo ci occupermo della seconda ipotesi, il monitoraggio tramite un Prometheus esterno al k8s.
Ma come può il mio Prometheus accedere alle metriche dei Pod e dei Container?
Grazie all’integrazione tra Prometheus è k8s è possibile prelevare le metriche del cluster utilizzando l’API del k8s, le API fanno da proxy verso le metriche esposte automaticamente all’interno del cluster dai pod e dal cAdvisor.
Affinchè questa integrazione funzioni è necessario che l’API del Kubernetes sia abilitata all’utenticazione tramite auth token e che il cAdvisor sia abilitato all’interno del cluster. Ma andiamo per gradi.
cAdvisor is an open source container resource usage and performance analysis agent. It is purpose-built for containers and supports Docker containers natively. In Kubernetes, cAdvisor is integrated into the Kubelet binary. cAdvisor auto-discovers all containers in the machine and collects CPU, memory, filesystem, and network usage statistics. cAdvisor also provides the overall machine usage by analyzing the ‘root’ container on the machine.
Note | […] the kubelet uses token authentication and authorization, as otherwise Prometheus needs a client certificate, which gives it full access to the kubelet, rather than just the metrics. Token authentication and authorization allows more fine grained and easier access control. This means the kubelet configuration must contain these flags:
|
Kubelet is a systemd service running on the Kubernetes master and on each of the Kubernetes nodes. As of version 1.10, kubeadm configures the kubelet service via command line arguments defined in /etc/systemd/system/kubelet.service.d/10-kubeadm.conf.
As shown in the kube-prometheus-on-kubeadm documentation, we need two changes:
Remove the cadvisor-port=0 flag in order to enable the cadvisor.
Add the —authentication-token-webhook=true flag.
Instead of modifying the file 10-kubeadm.conf, we create a new file 11-kube-prometheus.conf. These files are applied in alphabetical order, so settings in the our file will overwrite the original settings from 10-kubeadm.conf.
Our 11-kube-prometheus.conf file looks like this:
[Service]
# Remove the cadvisor-port=0 setting to expose the cadvisor metrics
Environment="KUBELET_CADVISOR_ARGS="
# allow webhook token authentication.
Environment="KUBELET_AUTH_TOKEN_WEBHOOK=--authentication-token-webhook=true --authorization-mode=Webhook"
ExecStart=
ExecStart=/usr/bin/kubelet $KUBELET_KUBECONFIG_ARGS $KUBELET_SYSTEM_PODS_ARGS $KUBELET_NETWORK_ARGS $KUBELET_DNS_ARGS $KUBELET_AUTH_TOKEN_WEBHOOK $KUBELET_AUTHZ_ARGS $KUBELET_CGROUP_ARGS $KUBELET_CADVISOR_ARGS $KUBELET_CERTIFICATE_ARGS $KUBELET_EXTRA_ARGS
Note that in order to override ExecStart, we first need to make it empty and then re-define it. Otherwise we would just be adding an additional command instead of replacing the command.
Come sempre noi consigliamo di gestire il [Prometheus] esterno tramite [Docker] in modo da semplificarne la configurazione e la sua gestione nel tempo.
version: '3'

services:

  prometheus:
    image: prom/prometheus:v2.5.0
    container_name: prometheus
    ports:
      - 9090:9090
    restart: always
    user: '1000'
    volumes:
        - "$PWD/promdata:/prometheus"
        - "$PWD/promconf:/etc/prometheus:ro"
    command: "--config.file=/etc/prometheus/prometheus.yml --storage.tsdb.retention=90d"
    logging:
      driver: "json-file"
      options:
        max-size: "200k"
max-file: "10"global:
scrape_interval: 15s
evaluation_interval: 15s
external_labels:
monitor: 'SkyTv'
rule_files:
- '/etc/prometheus/prometheus.rules'
scrape_configs:
- job_name: 'kubernetes-apiservers'
kubernetes_sd_configs:
- role: endpoints
api_server: https://kubernetes.default.svc
tls_config:
ca_file: /etc/prometheus/ca.crt
bearer_token_file: /etc/prometheus/kube-api-token
scheme: https
tls_config:
ca_file: /etc/prometheus/ca.crt
bearer_token_file: /etc/prometheus/kube-api-token
relabel_configs:
- source_labels: [__meta_kubernetes_namespace, __meta_kubernetes_service_name, __meta_kubernetes_endpoint_port_name]
action: keep
regex: default;kubernetes;https
- job_name: 'kubernetes-nodes'
scheme: https
tls_config:
ca_file: /etc/prometheus/ca.crt
bearer_token_file: /etc/prometheus/kube-api-token
kubernetes_sd_configs:
- role: node
api_server: https://kubernetes.default.svc
tls_config:
ca_file: /etc/prometheus/ca.crt
bearer_token_file: /etc/prometheus/kube-api-token
relabel_configs:
- action: labelmap
regex: __meta_kubernetes_node_label_(.+)
- target_label: __address__
replacement: kubernetes.default.svc
- source_labels: [__meta_kubernetes_node_name]
regex: (.+)
target_label: __metrics_path__
replacement: /api/v1/nodes/${1}/proxy/metrics
- job_name: 'kubernetes-cadvisor'
scheme: https
tls_config:
ca_file: /etc/prometheus/ca.crt
bearer_token_file: /etc/prometheus/kube-api-token
kubernetes_sd_configs:
- role: node
api_server: https://kubernetes.default.svc
tls_config:
ca_file: /etc/prometheus/ca.crt
bearer_token_file: /etc/prometheus/kube-api-token
relabel_configs:
- action: labelmap
regex: __meta_kubernetes_node_label_(.+)
- target_label: __address__
replacement: kubernetes.default.svc
- source_labels: [__meta_kubernetes_node_name]
regex: (.+)
target_label: __metrics_path__
replacement: /api/v1/nodes/${1}/proxy/metrics/cadvisorversion: '3'
services:
grafana:
image: grafana/grafana:5.3.2
container_name: grafana
ports:
- 3000:3000
restart: always
volumes:
- "$PWD/data:/var/lib/grafana"
user: '1000'
environment:
GF_SMTP_ENABLED: 'false'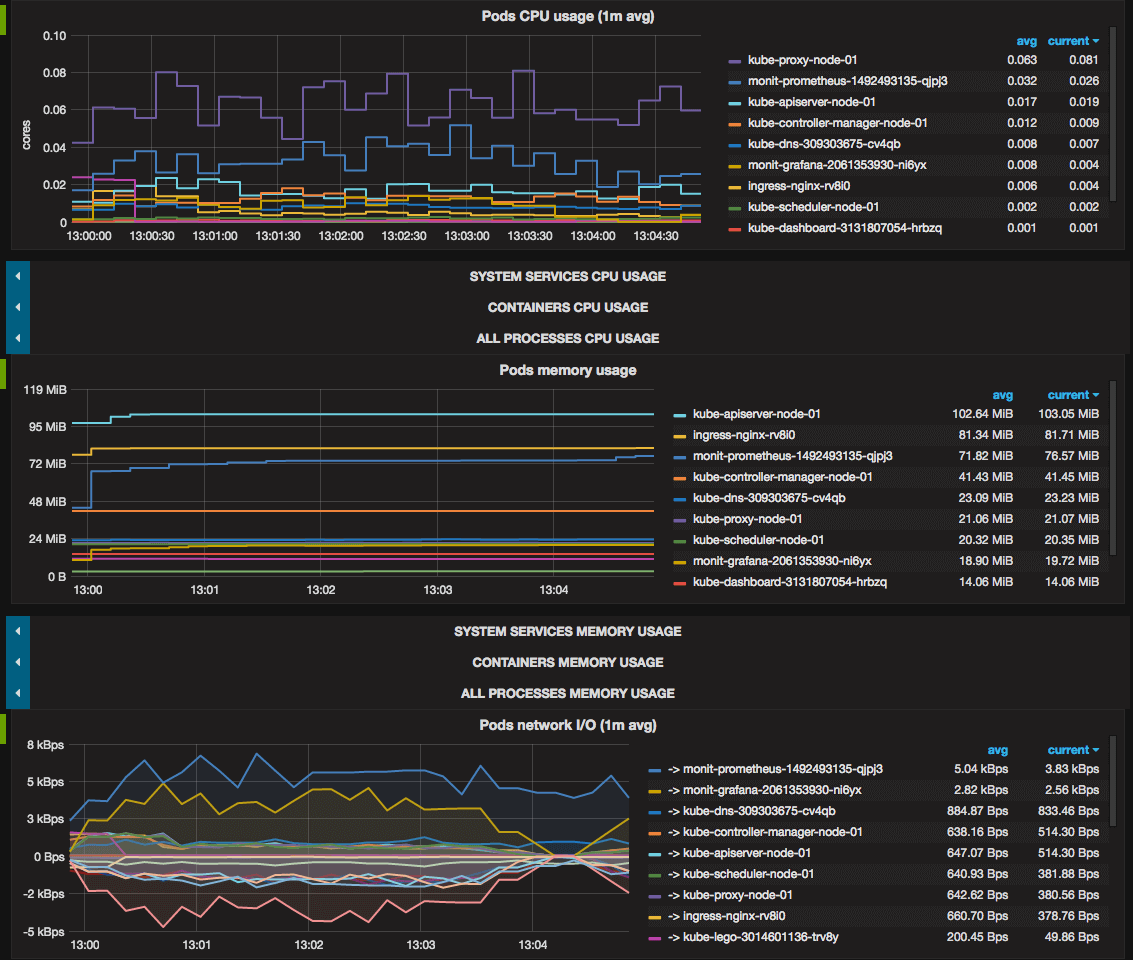
[Prometheus] https://prometheus.io/
[Grafana] https://grafana.com
[Prometheus_Operator] https://github.com/coreos/prometheus-operator
[Docker] https://docker.com
[Docker_Compose] https://docs.docker.com/compose/
[Prometheus_2.5.0_binary] https://github.com/prometheus/prometheus/releases/download/v2.5.0/prometheus-2.5.0.linux-amd64.tar.gz
[Installing_Grafana_on_RPM-based_Linux] http://docs.grafana.org/installation/rpm/
[Prometheus_Node_Exporter] https://github.com/prometheus/node_exporter
[RedHat_Getting_Started_Orchestrating_Containers_with_kubernetes] https://access.redhat.com/documentation/en-us/red_hat_enterprise_linux_atomic_host/7/html/getting_started_with_kubernetes/get_started_orchestrating_containers_with_kubernetes

Business Software Solutions